
by Tanve Sribharath
Key message: Total protein quantification is a routine step in cell culture, yet different protein assays can produce substantially different results for the same biological sample. Understanding assay chemistry and resulting apparent protein levels is essential for selecting the most appropriate method to ensure meaningful comparisons between complex samples, such as fetal bovine serum (FBS) and human platelet lysate (hPL).
Cell culture supplements play an important role in providing biomolecules that maintain growth and overall health of the cells. Proteins are crucial biomolecules that are abundant in supplements, and quantification can help us understand what the cells are actually being exposed to. Thus, total protein quantification can provide details on batch-to-batch consistency and biological performance of the supplement.
Total protein quantification methods can broadly be categorised as copper-binding, protein-dye, and UV-based assays. Of these, Lowry’s method (copper-binding) and Bradford assay (protein-binding) are most commonly used in laboratories. Although all total protein assays aim to estimate protein concentration, they rely on different detection chemistries and can produce different results for the same biological sample. Here, we aimed to compare the Bradford assay and Lowry’s method to quantify the total protein levels in fetal bovine serum (FBS) and human platelet lysate (hPL).
Principle
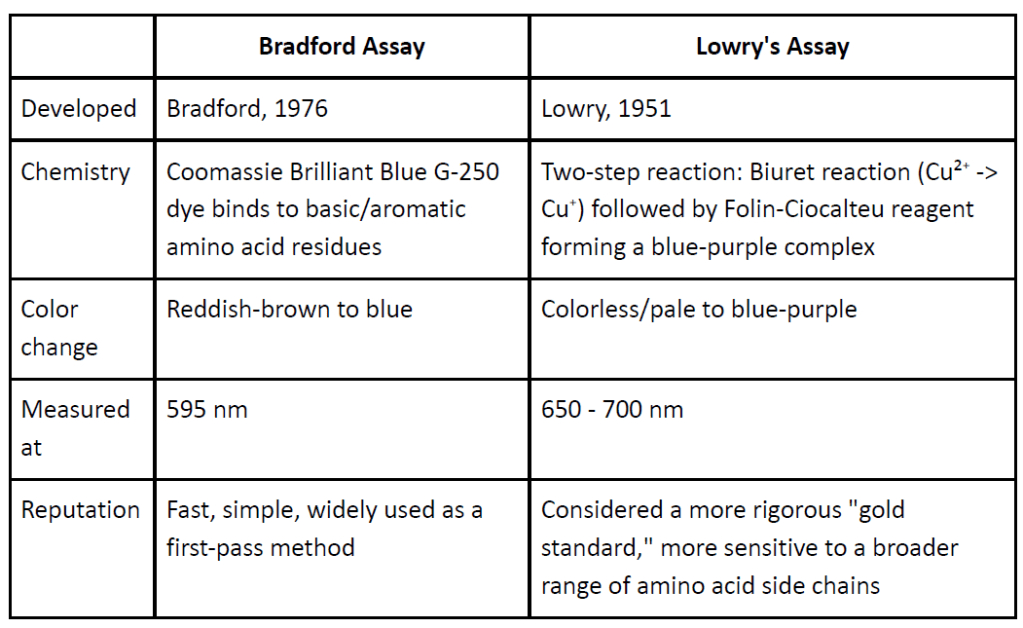
Both assays are colorimetric methods in which the protein concentration is estimated from the intensity of colour development. The intensity of the colour developed is measured using a spectrophotometer. A standard curve is generated using known concentrations of bovine serum albumin (BSA), and the protein concentrations of unknown samples are determined by interpolation from this curve. Therefore, a good standard curve is essential in producing reliable estimates. A good standard curve has a strong linear fit (R² close to 1), no signal saturation, and a blank that reads close to zero.
Methodology
- Standards: A BSA stock solution (1 mg/mL) was diluted to generate a five-point standard curve (200, 400, 600, 800, and 1,000 μg/mL), alongside a blank.
- Samples: To ensure that the measured absorbance was within the linear range of the standard curve, FBS and hPL were each diluted 1:10, based on prior reports that both supplements contain roughly 30–40 mg/mL total protein.
- Assay procedure: Both assays were performed in a 96-well format. For the Bradford assay, 190 μL of Bradford reagent was added to each well, followed by 10 μL of the BSA standards, blank, or diluted sample. Plates were incubated for 5 minutes at ambient temperature before reading absorbance at 595 nm. All standards and samples were run in duplicate.
For Lowry’s method, 25 μL of the BSA standards, blank, or diluted sample was added to each well, followed by 125 μL of freshly prepared alkaline copper reagent and 12.5 μL of diluted Folin–Ciocalteu reagent. Milli-Q water was added to bring the final reaction volume to 200 μL. Plates were gently mixed, incubated for 20 minutes at ambient temperature, and the absorbance was measured at 700 nm. - Data analysis: Mean absorbance values were calculated from technical replicates, followed by blank subtraction. Standard curves were generated by plotting blank-corrected absorbance against BSA concentration. Protein concentrations of FBS and hPL were determined by interpolation from the standard curve and corrected for the sample dilution factor. Data were presented as the mean ± standard deviation across three independent trials.
- Quality control: standard curves were required to reach R² ≥ 0.95, and replicate CV was required to stay ≤5% to be considered acceptable.
What We Observed
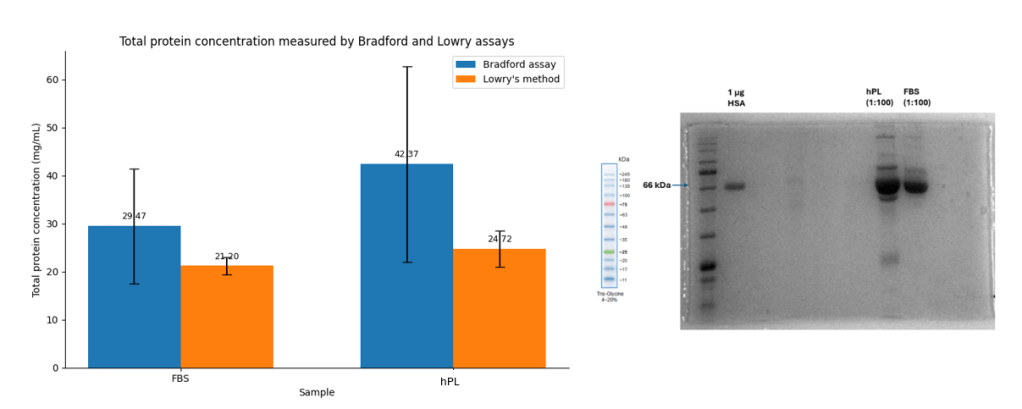
Both the Bradford assay and Lowry’s method indicated that hPL contained a higher total protein concentration than FBS. To confirm these results, SDS-PAGE was performed using human serum albumin (HSA) as a control. These results showed that while both samples contain abundant albumin, differences in the intensity and distribution of other protein bands demonstrate that the overall protein composition differs between FBS and hPL.
Compared to data from Lowry’s method, data from the Bradford assay consistently produced higher protein estimates and exhibited greater variability. These findings demonstrate that measured protein concentration is assay-dependent and highlight the importance of selecting the right assay based on protein composition and sample complexity.
Why This Matters
The original papers describing Bradford’s assay and Lowry’s Method have been cited over 200,000 and 400,000 times, respectively. While the Bradford assay offers rapid and sensitive protein estimation, it estimates protein concentration based on the binding of Coomassie Brilliant Blue dye. This can result in the high variability observed and overestimation in the apparent total protein concentrations in complex samples. In contrast, Lowry’s method produced more consistent measurements, as it relies on copper reduction followed by reduction of the Folin–Ciocalteu reagent. As these assays can provide substantially different estimates, understanding detection chemistries is particularly relevant when analysing complex samples, such as FBS and hPL, which contain diverse mixtures of proteins rather than a single purified protein.
Takeaways:
- Both Bradford’s assay and Lowry’s method showed that hPL contained higher protein levels than FBS; however, the absolute values varied due to different detection chemistries.
- Bradford’s assay values showed greater variation among samples, even though the same batches were used across trials.
- The choice of the quantification assay should consider the composition and complexity of the biological sample to enable reliable estimation and meaningful comparisons across studies.
Further Reading:
Lu TS, Yiao SY, Lim K, Jensen RV, Hsiao LL. Interpretation of biological and mechanical variations between the Lowry versus Bradford method for protein quantification. N Am J Med Sci. 2010 Jul;2(7):325-8. doi: 10.4297/najms.2010.2325.
About Tanve Sribharath

Tanve is an A-level student with a strong academic foundation in Biology, Chemistry, Physics, and Mathematics, currently a biology major aspirant, looking to pursue her undergraduate degree. She is passionate about gaining real-world research experience.
Alongside scientific training, she develops computational skills in Python and web development while pursuing independent learning in the biological sciences. Experienced in leading student initiatives, including founding the Manthan Books, Movies, and Literature Club, and actively seeking opportunities to contribute to meaningful scientific research.


Leave a Reply